
VotersUnite.Org
is NOT!
associated with
votersunite.com
| Touchscreen Voting Increases Election Costs in Florida Report on a Survey of Changes in Total Annual Expenditures for Florida Counties Before and After Purchase of Touch Screens: A Comparison of Total Annual Expenditures for Touch Screens and Optical Scanners. By Dr. Rosemarie Myerson and Richard Myerson |
||
| In February of 2005, Dr. Rosemarie Myerson completed a study of annual expenditures of the election departments of two Florida counties. The data showed the cost of using touch screen voting machines in Sarasota county was higher than the county’s previous cost when using punch cards and higher than the cost of using optical scanners in a neighboring county. This enlightening study made people aware that not only are touch screens more expensive to acquire, they are also more expensive to operate year after year. |
|
|
|
Dr. Myerson and her husband have now completed a study of all 67 Florida counties, and they found that the data supports Dr. Myerson’s initial findings. In the conclusion, they state, "[The statistical analysis] indicates a 40.4% higher increase in expenses for touchscreen counties than for optical scanner counties."
Read the entire report in pdf format, or Download the Excel data file. Purpose of the Study
This project was undertaken to study the changes in total expenditures by Florida’s 67 Supervisor of Elections offices before and after electronic touchscreen voting was instituted and to compare the effect of the type voting system on costs.
Background
Florida mandated that all counties replace punch cards and other systems with either electronic optical scanners or touchscreen voting machines prior to the 2002 elections. The purchase costs for the new voting equipment was reimbursed to the Supervisor of Elections’ office by the county’s commissioners so that the machine purchasing expenditures were never included in the Supervisor of Election’s annual expenditures. Counties that already owned optical scanners before 2001 did not have to change systems. There were 12 counties that responded completely to this survey that did not need to change their voting machines since they were already using optical scanners.
Method
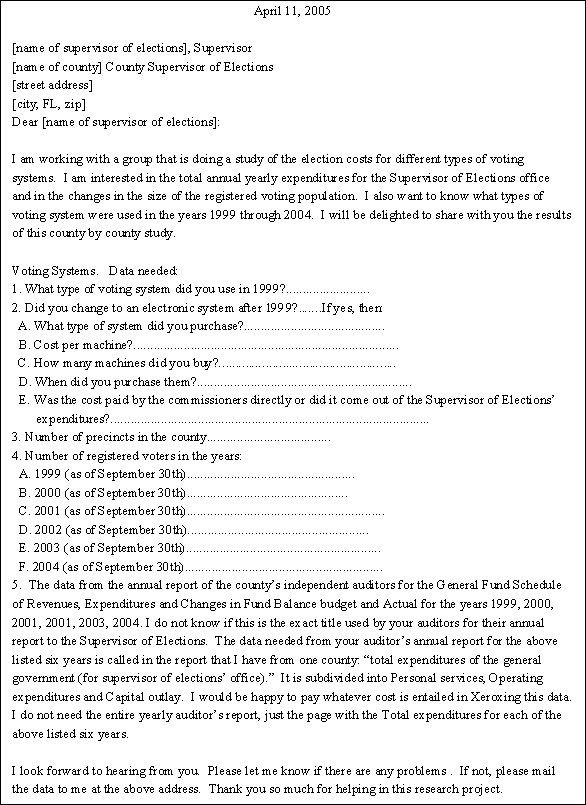
We requested data from the 68 counties in Florida (see request letter). Despite the fact that 50 counties responded, we were limited to analyzing the data of 32 counties because the other counties could not provide full data on the number of registered voters and /or total expenditures for the years selected.
To compare changes in the costs for each county for touchscreens versus optical scanners, total annual expenditures from the immediate pre- touchscreen period (2000 and 2001) were compared with the post- touch screen data (2003 and 2004). These four years were used in order to include in each period one presidential election year and one with no federal elections. Data from 2002 was excluded because in 2002 all but 12 of the 32 counties changed their voting systems which probably engendered special expenditures for education, training, special handling and storage. Also many counties did not include 1999 data so we could not compare three years pre- to three years post-touch screen purchase.
Analysis
A comparison of the difference in expenditures per 1000 voters of the 11 counties with touchscreen systems versus those 21 counties with optical scanning systems for the 2003/2004 period could not be meaningful for the following reasons:
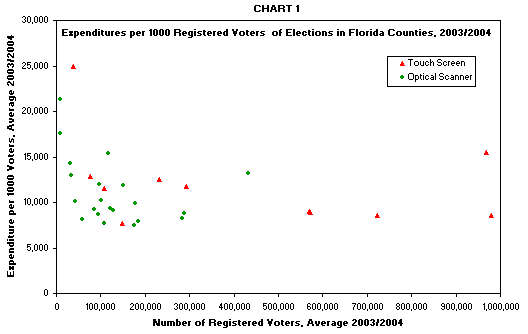
1) County size had a large effect on the cost, Chart 1 shows a scatter plot of the 2003/2004 data for each county’s costs per thousand voters versus the number of registered voters. Note that the small counties had higher costs per 1000 voters than the larger counties. Virtually all the small counties were optical scanners and all of the very large counties were touchscreen. This implies some minimum costs for all counties independent of size of voting population.
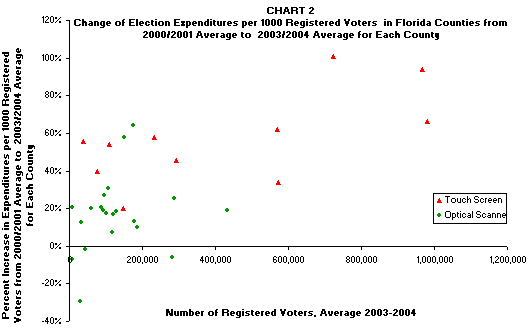
 2) There are also many unknown expenditure variables in county to county data such as what functions are included in each county’s annual expenditures, counties use different accounting protocols, some show debt service as an expense and the uncertainty as to what special services any county provides. These variables makes conclusions regarding total expected annual cost differences between optical scan ownership and touchscreen ownership difficult and uncertain. The final analysis looked at the changes for each county in expenditures per 1000 registered voters from the pre touch screen period to the post period . We elected to use the average of 2003 and 2004 expenditures per 1000 registered voters divided by the average of the 2000 and 2001 expenditures per 1000 registered voters to determine the percentage change for each county. We then took the average of the percentage change for each of the 11 touchscreen counties and compared these to the average of the percentage change for each of the 21 optical scan counties. The statistical analysis showed that touchscreen counties had an average increase of 57.3% in per-capita cost versus a value of 16.9% as the average of per-capita increase among counties with optical scanners. The difference between these two averages is 40.4% (57.3% minus 16.9%). This indicates a 40.4% higher increase in expenses for touchscreen counties than for optical scanner counties. This is significant at a 95% confidence level. Chart 2 is a scatter plot of the percent change of the expenditures in each county per 1000 registered voters before and after purchase of touchscreens. 
Conclusion
The annual increase for optical scanner cost may be due partly to inflation and partly to special demands by the State. One Supervisor of Elections stated that since 2002 the State mandated special things every year. For example prior to 2002, he programmed his own machines; after 2002 every year the State required that the county buy new software from the manufacturer to program their optical scanners.
The results from this study show that a county’s buying touchscreens will increase their annual expenditures by 57.3%. Owning optical scanners should increase their expected annual costs 16.9%. Optical scanners have the further advantage of providing a voter verified paper ballot that can be used to audit the machine’s data and for any needed independent recount. To match this auditing advantage of optical scanners, the present touch screen systems would require the county to purchase and maintain a large number of printers, an additional set of costs that would significantly increase the county’s annual expenses.
One factor that may explain why having touchscreens cost so much more than optical scanners is because the county has to own and maintain so many more machines. We estimate that one optical scanner can count handle six voter’s votes a minute (or 360 per hour) as they are cast but because it takes a voter at least three minutes to vote with touchscreens, it would take 20 touchscreens to perform per hour as well as optical scanners. In order not to have huge waiting lines on election day, most counties buy 10 touchscreens per precinct. Thus while one optical scanner adequately serves a precinct, the precinct needs approximately ten times as many touchscreens in order not to have huge lines of voters waiting to vote.

or a place to hang your hat, but it's something you do. You participate. If you stop doing it, democracy crumbles. |
||